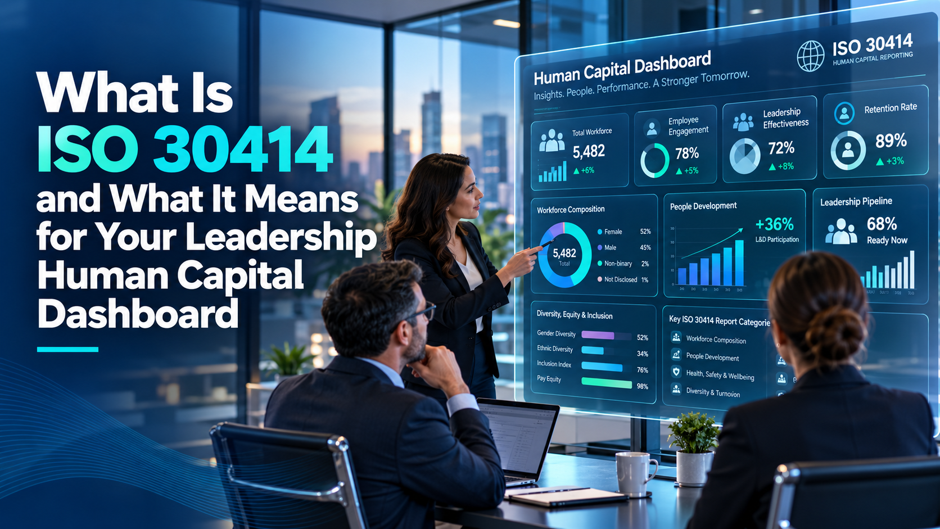
A board member glances at the quarterly people metrics slide, sees headcount, turnover, and a diversity percentage, and asks a question that catches the CHRO off guard: how does any of this compare to what a peer company reports, and how would an investor evaluating both companies actually know which workforce is genuinely the stronger asset? That question sits at the center of why ISO 30414 exists, and why the standard’s significantly revised 2025 edition matters considerably more to how a leadership dashboard gets built than most HR teams currently realize.
ISO 30414 is the world’s first international standard for human capital reporting, and its 2025 revision represents a genuine, substantive shift in both scope and ambition compared to the original 2018 version. Understanding exactly what the standard covers, what changed in this latest edition, and how its structure should actually inform what appears on a leadership human capital dashboard gives HR and finance leaders a considerably clearer framework for building reporting that holds up under genuine board, investor, and regulatory scrutiny, rather than a dashboard assembled around whatever metrics happened to be easiest to pull from the HRIS.
TL;DR
| Element | What it means in practice |
| What ISO 30414 actually is | The world’s first international standard providing a structured framework for measuring, managing, and reporting human capital, both internally and externally |
| The 2025 revision’s core shift | Reframes human capital from an organizational cost to report on into a strategic intangible asset that drives long-term value and competitiveness |
| Scope of the standard | 69 standardized metrics organized across 11 core areas of human capital, supported by 17 or more detailed technical specifications |
| Why this matters for dashboards specifically | A leadership dashboard built around the standard’s 11 areas gives boards and investors a structure they can genuinely compare across companies and reporting periods |
| The regulatory backdrop driving adoption | SEC human capital disclosure requirements and the EU’s Corporate Sustainability Reporting Directive are pushing workforce reporting toward exactly this kind of structured framework |
| What’s genuinely new in this edition | Expanded guidance on AI, ethics, and data governance, alongside deeper alignment with broader ESG and sustainability reporting frameworks |
The thread connecting every row above: a leadership human capital dashboard built loosely around whatever metrics happen to be genuinely convenient to pull will increasingly look thin next to one deliberately structured around a recognized international standard, particularly as regulatory expectations around workforce disclosure continue tightening steadily across multiple jurisdictions.
What ISO 30414 Actually Is
Before working through what the standard genuinely means for a specific dashboard, it’s worth establishing clearly what ISO 30414 actually covers and exactly where it came from originally, since understanding its origin clarifies exactly why the 2025 revision represents such a meaningful, substantive shift for reporting practice.
The Standard’s Core Purpose and History
ISO 30414 was first issued in 2018 as a framework for consistent, structured reporting of workforce-related metrics, giving organizations a standardized way to measure, manage, and report on human capital for both internal management purposes and external disclosure. The standard’s core premise, that purposeful, deliberate investment in people creates and preserves genuine organizational value, positioned it from the very start as considerably more ambitious than a simple compliance checklist, even though many organizations initially treated it primarily as exactly that.
Why the 2025 Edition Represents a Genuine Reframing
The second edition, formally titled Human Resource Management, Requirements and Recommendations for Human Capital Reporting and Disclosure, goes considerably further than the original 2018 version by reorganizing the underlying metrics, deepening alignment with global sustainability reporting frameworks, expanding the areas covered, and introducing entirely new guidance on emerging issues like artificial intelligence, ethics, and data governance. At its core, ISO 30414:2025 reframes human capital not as an organizational expense to be managed down, but as a genuine strategic intangible asset, one that drives long-term performance and competitiveness in much the same way financial or physical capital does.
Why This Reframing Matters More Than It Might Initially Seem
A dashboard built around the premise that human capital metrics exist primarily to track cost and compliance looks meaningfully different from one built around the premise that these same metrics exist to demonstrate genuine value creation. The 2025 revision’s explicit reframing pushes organizations toward the second interpretation, and a leadership dashboard that hasn’t caught up with this shift risks presenting a genuinely dated, narrower story than what boards and investors are increasingly expecting to see.
The 11 Core Areas the Standard Covers
With the standard’s purpose and history now genuinely established and clearly understood, the practical structure below breaks down the specific areas ISO 30414 organizes human capital reporting around, since these areas should directly inform exactly how a leadership dashboard itself ultimately gets structured and organized in practice.
The Full Breakdown Across 11 Areas
| Core area | What it covers |
| Workforce composition | The number and employment types of workers contributing to organizational outcomes, including full-time, part-time, and contingent workers |
| Diversity | Demographics and other personal characteristics of individuals contributing to organizational outcomes |
| Costs | The full range of workforce-related costs, from total compensation to the cost of turnover and recruitment |
| Compliance, ethics, and workforce relations | Governance and social commitments associated with maintaining lawful, ethical workforce practices |
| Organizational culture | The underlying values, behaviors, and environment shaping how work actually gets done |
| Leadership, culture, and engagement | Internal stakeholder synergies associated with organizational outcomes, spanning leadership effectiveness and employee engagement together |
| Organizational health, safety, and well-being | Physical and psychological safety outcomes, alongside broader employee well-being indicators |
| Productivity | The measurable output and value the workforce generates relative to its cost |
| Recruitment, mobility, and turnover | How effectively the organization attracts, moves, and retains talent |
| Skills, capabilities, and development | The overall strength and depth of the workforce’s current and developing capabilities |
| Succession planning and workforce availability | Readiness to fill critical roles and the broader availability of talent the organization depends on |
Why 69 Metrics Across 11 Areas Represents a Meaningful Expansion
The 2025 edition offers 69 standardized metrics across these 11 areas, a meaningful expansion from the 58 metrics the standard covered in its earlier form, reflecting both the reorganization of existing metrics and the introduction of genuinely new ones addressing areas like AI governance and expanded workforce definitions that simply weren’t part of the original 2018 scope. This expansion matters directly for dashboard design, since a dashboard built years ago around the original, narrower metric set may now be missing entire categories the current standard considers core to a complete human capital picture.
Why the Standard Is Supported by Detailed Technical Specifications
Beyond the core 69 metrics, more than 17 supporting technical specifications provide detailed measurement practices spanning each of the 11 core reporting areas, creating a genuinely comprehensive metrics ecosystem rather than a single, static checklist. These technical specifications matter particularly for organizations building a dashboard intended to genuinely withstand comparison against how peer companies are measuring the exact same underlying concept, since the specifications reduce ambiguity in exactly how a given metric should be calculated and reported.
Why This Matters for Your Leadership Dashboard Specifically
Understanding the standard’s structure is one thing entirely on its own; translating it into an actual, genuinely working leadership-facing dashboard requires connecting that structure directly to the regulatory and strategic pressures currently pushing organizations toward exactly this kind of ongoing reporting discipline in their daily practice.
The Regulatory Backdrop Driving Adoption
The regulatory environment is moving workforce information closer to mainstream corporate reporting. In the US, SEC human capital disclosure requirements have required public-company registrants since 2020 to discuss human capital resources when material to understanding the business, while the EU Corporate Sustainability Reporting Directive brings sustainability and workforce disclosures into a more structured reporting regime for companies within its scope.
The specific regulatory developments making ISO 30414-aligned reporting increasingly relevant, rather than optional:
- SEC human capital disclosure requirements, in effect since 2020, require all publicly traded US companies to disclose material workforce information directly within their annual 10-K filings
- The EU’s Corporate Sustainability Reporting Directive mandates detailed human capital reporting, complete with third-party assurance, for tens of thousands of European companies
- Broader ESG reporting frameworks increasingly expect workforce data to be reported with the same rigor and comparability traditionally reserved for financial metrics
- Investor expectations around workforce transparency continue rising independently of formal regulatory mandate, particularly among institutional investors evaluating long-term organizational resilience
Why Intangible Asset Value Makes This a Genuine Board-Level Concern
A significant majority of value creation within S&P 500 companies is now attributed to intangible assets rather than physical capital, and human capital consumes a substantial share of that intangible asset value specifically. This shift from a physical to an intellectual capital economy means a leadership dashboard covering only traditional headcount and turnover numbers is genuinely failing to capture the asset a board is increasingly being asked to evaluate and protect, in much the same way a dashboard ignoring a company’s physical capital investments would look obviously incomplete to the same audience.
Why a Loosely Structured Dashboard Increasingly Falls Short
A dashboard assembled around whichever metrics happen to be easiest to extract from an existing HRIS, without deliberate reference to a recognized external structure, tends to produce a genuinely inconsistent picture from one reporting period to the next, and offers a board no meaningful way to benchmark the organization’s workforce against peer companies reporting under a shared, common standard. Building a connected human capital platform around consistent leadership metrics instead gives a board a structure it can follow over time, while ISO 30414 provides the external reporting framework against which those metrics can be organized.
Translating the Standard Into Actual Dashboard Metrics
Moving from the standard’s formal structure to a practical, genuinely working dashboard requires carefully selecting specific metrics within each of the 11 areas that genuinely matter at the leadership level, rather than attempting to surface all 69 standardized metrics at once in a single, crowded board-facing view.
Leadership-Level Metrics Versus Operational HR Metrics
The distinction worth building directly into how a dashboard gets designed:
- Leadership-level metrics should summarize outcomes and trends a board can act on strategically, total workforce cost as a percentage of revenue, voluntary turnover among critical talent specifically, or succession coverage for the organization’s most critical roles
- Operational HR metrics, the detailed, granular data feeding into those leadership-level rollups, belong in HR’s own working dashboards rather than cluttering a board-facing view with more detail than that audience genuinely needs
- A well-designed leadership dashboard should make it easy to drill from a summary metric into its underlying operational detail when a specific question warrants it, without defaulting to that level of granularity every single reporting cycle
- Metrics selected for leadership visibility should map clearly back to one of the standard’s 11 core areas, making it straightforward to demonstrate the dashboard’s alignment with the broader ISO 30414 framework when a board or investor specifically asks
Example Metrics Worth Surfacing at the Leadership Level
| Core area | A leadership-appropriate metric example |
| Workforce composition | Total workforce size broken down by employment type, including the contingent and contractor share |
| Leadership, culture, and engagement | Employee engagement score trended over time, alongside leadership effectiveness ratings from internal surveys |
| Skills, capabilities, and development | Percentage of critical skills gaps closed through active training and development investment |
| Succession planning | Percentage of critical roles with a genuinely ready internal successor identified |
| Productivity | Revenue or value generated per full-time equivalent employee, tracked against prior periods |
An employee engagement survey system can supply the engagement and sentiment signals behind a leadership-level trend, while competency management can provide structured visibility into critical skills gaps and development progress rather than relying only on subjective assessments.
Succession readiness requires equally consistent underlying data. A succession planning system can connect critical positions, successor readiness, development activity, and risk information so the leadership metric reflects an active process rather than a static annual spreadsheet.
Why Selecting the Right Handful of Metrics Matters More Than Comprehensive Coverage
A leadership dashboard attempting to surface every one of the standard’s 69 metrics simultaneously overwhelms exactly the audience it’s meant to inform, burying the handful of genuinely strategic signals a board needs under a volume of operational detail better suited to an HR team’s own internal reporting. Selecting a focused, deliberate subset from each core area, one that genuinely reflects the organization’s specific strategic priorities, produces a considerably more useful board-level view than an exhaustive, undifferentiated data dump organized loosely around the standard’s full scope.
Emerging Trends Reshaping What Belongs on the Dashboard
Beyond the standard’s current, formal structure as it exists today, several emerging trends in human capital reporting practice point toward where leadership dashboards are genuinely likely headed next, and building awareness of these trends now helps a dashboard stay ahead of where reporting expectations are actually moving.
The Trends Worth Watching Closely
The specific directions human capital reporting practice is genuinely moving in, beyond the standard’s current formal scope:
- Expanding beyond traditional employees to cover the total workforce, including contractors, consultants, gig workers, and supply chain labor, reflecting growing stakeholder concern about precarious work and labor practices across an organization’s full value chain
- Deeper skills and capabilities transparency, specifically addressing critical skill gaps, reskilling investment, and genuine future-readiness for digital transformation and automation
- Expanded pay equity and fair wage disclosure, spanning gender and demographic pay gaps, CEO-to-median-worker pay ratios, and demonstrated wage progression over time
- Broader well-being and mental health metrics, extending beyond traditional physical safety data into psychological safety, burnout prevention, and genuine work-life balance indicators
Building this view requires more than passive reporting. A training management system can give leadership measurable evidence of skills-development activity and completion, while compensation planning can connect pay decisions, budgets, performance information, and compensation structures when organizations examine workforce cost and equity patterns.
Why Total Workforce Scope Represents a Genuine Dashboard Expansion
A dashboard built around traditional employee headcount alone increasingly misses a meaningful share of the actual workforce driving organizational outcomes, particularly as contractor, gig, and other non-employee labor arrangements become more common across many industries. The ESRS S1 Own Workforce framework also distinguishes employees from non-employees within an undertaking’s own workforce, reinforcing why organizations need clearer visibility into people contributing to outcomes beyond traditional permanent headcount.
A practical dashboard therefore needs enough workforce structure underneath it to model changes rather than merely describe them after the fact. Workforce planning can connect headcount, staffing scenarios, organizational changes, costs, and talent gaps so leadership can assess future workforce requirements alongside current reporting.
Why AI and Data Governance Now Belong on a Human Capital Dashboard
The 2025 revision’s explicit new guidance on AI, ethics, and data governance reflects a genuine, growing expectation that organizations report not just on their human workforce, but on how AI and automation are actively reshaping that workforce, and on the ethical and governance safeguards in place around how workforce data itself gets used. A leadership dashboard that hasn’t yet incorporated any signal on this front risks looking genuinely incomplete against the standard’s current, expanded scope, even if every traditional metric on that same dashboard remains solid and well-constructed.
A Real-World Example of the Standard in Practice
Seeing how an organization actually applies ISO 30414’s framework in genuine, day-to-day practice helps translate the standard’s formal structure into something considerably more concrete and directly usable than an abstract list of categories and metrics sitting on a printed page somewhere in a binder on a shelf.
What a Genuine Implementation Looked Like
One organization applying the standard’s framework established specific, genuinely measurable human capital objectives directly tied to several of the standard’s 11 core areas, then tracked progress against those specific objectives systematically and consistently over an extended, multi-year period of ongoing, deliberate time and sustained leadership attention.
| Objective set | What was targeted |
| Turnover and retention | A specific technical talent turnover target, tracked quarterly against the organization’s broader retention strategy |
| Diversity in technical and leadership roles | Defined percentage targets for women in both technical roles specifically and broader leadership positions |
| Engagement | A specific target engagement score, tracked through regular internal survey data |
| Skills development | A defined number of employees reached through structured training addressing identified critical skills gaps |
| Succession readiness | A specific percentage target for succession coverage across the organization’s most critical roles |
How This Translated Into Actual Dashboard and Reporting Practice
Implementation enabled systematic quarterly management reporting internally, alongside annual public disclosure within the organization’s broader sustainability report, a combination that reportedly attracted positive investor feedback and measurable improvements in external ESG ratings over time. The organization also used the standard’s structure to benchmark its own progress against peer organizations, identifying successful practices worth adapting internally, and to evaluate specific programs more rigorously. Linking those results to an ongoing performance management process can help leadership compare development, competency, appraisal, and performance information rather than evaluating a leadership initiative in isolation.
Why This Example Illustrates the Standard’s Practical Value Beyond Compliance
What makes this kind of implementation genuinely instructive isn’t simply that the organization tracked more metrics; it’s that those metrics were explicitly tied to specific, defined targets within the standard’s core areas, then used actively to evaluate whether specific programs and investments were genuinely working, rather than being reported passively as a once-a-year compliance exercise disconnected from actual decision-making. This is precisely the shift the 2025 revision’s reframing toward human capital as a strategic asset is meant to encourage: metrics that inform genuine strategic decisions, not metrics collected purely to satisfy an external reporting requirement.
Common Mistakes When Building an ISO 30414-Aligned Dashboard
Beyond simply understanding the standard’s structure in the abstract, several recurring, genuinely predictable mistakes show up consistently among organizations attempting to build a leadership dashboard genuinely aligned with ISO 30414, and avoiding them considerably improves the odds the resulting dashboard actually holds up under real, ongoing board scrutiny.
Treating the standard as a one-time compliance checklist rather than an ongoing framework. Building a dashboard once against the standard’s current structure, then leaving it largely unchanged as the standard itself continues evolving, produces reporting that quietly falls out of alignment over time, particularly given how substantially the 2025 revision already changed the standard’s scope compared to its 2018 predecessor.
Surfacing too much operational detail at the leadership level. A board-facing dashboard cluttered with every available metric from each of the 11 core areas buries the genuinely strategic signals a board needs under a volume of granular, operational detail that belongs instead in HR’s own internal reporting rather than a leadership summary view.
Selecting metrics without genuine reference to organizational strategy. Choosing dashboard metrics purely because they’re easy to pull from an existing HRIS, rather than because they genuinely reflect the organization’s specific strategic priorities within each core area, produces a dashboard that technically maps to the standard’s structure while still failing to tell a genuinely useful strategic story.
Ignoring the standard’s expanded scope around total workforce and AI governance. Continuing to report only on traditional, directly employed headcount, without acknowledging contractor and gig workforce contributions or emerging AI governance considerations, leaves a dashboard looking dated against the standard’s genuinely expanded 2025 scope.
Failing to connect dashboard metrics back to formal regulatory disclosure requirements. A dashboard built in isolation from what the organization is separately required to disclose under SEC or EU regulatory requirements creates unnecessary duplicate work and risks inconsistency between what leadership sees internally and what gets formally disclosed externally.
Treating the standard’s 11 areas as equally weighted regardless of industry or strategy. Not every organization needs to invest equal dashboard attention across all 11 core areas; a technology company facing acute competition for scarce technical talent likely needs considerably deeper visibility into skills and recruitment metrics than a more stable, less talent-constrained industry, and forcing artificially even coverage across every area dilutes attention away from the specific areas where the organization’s genuine strategic risk actually concentrates.
Who Should Own the Dashboard Inside the Organization
Building a dashboard genuinely aligned with ISO 30414 requires more than selecting the right metrics; it requires clear, explicit ownership of both the underlying data and the dashboard’s ongoing maintenance, since a dashboard nobody specifically owns tends to drift out of alignment with the standard over time.
Dividing Ownership Across HR, Finance, and the Board Itself
| Responsibility | Typical owner | Why this division makes sense |
| Selecting which specific metrics represent each core area | HR leadership, in consultation with the CHRO | HR holds the clearest, most direct view of which metrics genuinely reflect organizational strategy within each of the standard’s 11 areas |
| Validating data quality and consistency across reporting periods | HR analytics or people-data teams, often working alongside finance | Requires genuine technical rigor in how underlying workforce data gets collected, cleaned, and reconciled over time |
| Connecting dashboard metrics to formal regulatory disclosure | Finance and legal, working directly with HR | Formal disclosure obligations, like SEC 10-K filings or EU directive requirements, carry legal and financial reporting implications beyond HR’s typical scope alone |
| Reviewing and interpreting the dashboard at the board level | The board itself, often through a dedicated committee | The board holds ultimate responsibility for evaluating whether the organization’s human capital strategy is genuinely working |
| Keeping the dashboard’s structure current against standard revisions | A designated cross-functional owner, typically within HR | Without explicit ownership of this specific task, dashboard structure quietly falls behind as the underlying standard itself continues evolving |
Why Cross-Functional Ownership Produces a Genuinely Stronger Dashboard
A dashboard built entirely within HR, without genuine input from finance and legal on how the underlying metrics connect to formal disclosure obligations, risks producing reporting that looks internally coherent but doesn’t actually align with what the organization is separately, legally required to disclose externally. Conversely, a dashboard driven entirely by finance or legal compliance concerns, without genuine HR strategic input on which metrics actually matter, risks becoming a narrow, checkbox-style exercise that misses the standard’s broader ambition toward demonstrating genuine human capital value creation.
Why the Board’s Own Engagement With the Dashboard Matters as Much as Its Construction
A well-constructed dashboard still delivers limited value if the board itself doesn’t genuinely engage with it, treating the quarterly or annual human capital review as a brief formality rather than a genuine opportunity to evaluate organizational strategy. Boards that build dedicated time and genuine discussion around the human capital dashboard, comparable to how they already engage with financial reporting, consistently extract considerably more strategic value from the underlying data than boards that treat the same reporting as a passive, one-way information dump.
FAQs
Is ISO 30414 certification legally required for any organization?
No, ISO 30414 itself is a voluntary international standard rather than a legal requirement, and the certification landscape around it remains genuinely small and early-stage, with only a modest number of professionals holding formal certification globally so far. That said, the standard’s structure increasingly overlaps with genuinely mandatory regulatory requirements, like SEC human capital disclosure rules and the EU’s Corporate Sustainability Reporting Directive, making voluntary alignment with the standard’s framework a practical way to prepare for requirements that are genuinely mandatory.
How is the 2025 revision of ISO 30414 different from the original 2018 version in practical terms?
The 2025 revision reorganizes and expands the underlying metrics, growing from 58 to 69 standardized metrics, deepens alignment with broader ESG and sustainability reporting frameworks, and introduces genuinely new guidance on AI, ethics, and data governance that simply didn’t exist in the original version. Practically, this means a dashboard built against the 2018 version’s structure likely needs meaningful updates to reflect the current, considerably broader scope of the 2025 edition.
Should a private company without any formal disclosure requirement still care about ISO 30414?
Yes, genuinely so, since the standard’s core value extends well beyond formal external disclosure into how an organization manages and understands its own workforce internally. A private company using the standard’s 11 core areas to structure its own leadership dashboard gains a genuinely more complete, comparable view of its human capital, independent of whether any external regulatory body ever requires that same information to be formally disclosed.
How many of the standard’s 69 metrics should actually appear on a board-level leadership dashboard?
There’s no fixed, universal number, but the general principle favors a deliberately curated subset, typically a handful of genuinely strategic metrics from each of the 11 core areas, rather than an exhaustive attempt to surface all 69 metrics simultaneously. The specific metrics selected should reflect the organization’s own strategic priorities within each area, rather than defaulting to whichever metrics happen to be easiest to extract from existing systems.
Does adopting ISO 30414’s framework require a completely new HR technology system?
Not necessarily. Organizations already compliant with related ISO standards, such as ISO 9001 for quality management or ISO 45001 for safety management, often already have much of the underlying data infrastructure needed to meet ISO 30414’s requirements, since these related standards share overlapping data and process foundations. The more significant work typically involves reorganizing and connecting existing data around the standard’s specific 11-area structure, rather than building entirely new data collection systems from scratch.
How often should a leadership dashboard built around ISO 30414 actually be updated or revisited?
Given how substantially the standard itself changed between its 2018 and 2025 editions, an annual review of the dashboard’s structure against the standard’s current scope is a reasonable baseline, with more frequent updates warranted whenever a significant regulatory change, like a new SEC disclosure requirement or an EU directive update, directly affects what the organization needs to report and track going forward.
What’s the single biggest risk of not aligning a leadership human capital dashboard with a recognized standard like ISO 30414 at all?
The biggest risk is producing reporting that looks genuinely inconsistent and difficult to benchmark, both against peer organizations and across the company’s own reporting periods over time, precisely at a moment when boards, investors, and regulators are all increasingly expecting workforce data to be reported with the same structure and rigor traditionally reserved for financial reporting. A dashboard with no reference to a recognized external framework leaves a board with no genuine way to judge whether what they’re seeing represents a complete, comparable picture of the organization’s human capital, or simply whatever metrics happened to be most convenient to compile that particular quarter.
How does ISO 30414 relate to other ISO standards an organization might already hold, like ISO 9001 or ISO 45001?
The standard shares meaningful structural overlap with several other widely adopted ISO standards, particularly those built on the shared Annex SL framework common across many ISO management system standards. Organizations already compliant with ISO 9001 for quality management or ISO 45001 for occupational safety management often already maintain much of the underlying process discipline and data infrastructure ISO 30414 itself depends on, particularly around organizational health, safety, and well-being reporting specifically, since these related standards were designed from the outset to work together rather than in isolation from one another.
Can a leadership dashboard built around ISO 30414 help identify workforce risks before they become genuinely serious problems?
Yes, and this is arguably one of the standard’s more underappreciated practical benefits beyond formal disclosure and compliance. A dashboard structured around the standard’s 11 core areas, tracked consistently over successive reporting periods, tends to surface emerging trends, a gradual rise in voluntary turnover among a specific critical role, a widening skills gap in a function the organization increasingly depends on, well before that trend becomes severe enough to show up as an obvious, urgent crisis demanding immediate board attention with far fewer good options remaining to address it.
What should an organization do if its current HR technology can’t easily produce metrics mapped to the standard’s 11 core areas?
Rather than waiting for a full technology overhaul before beginning any alignment work, most organizations find it more practical to start with whatever data is genuinely accessible today, mapping it loosely against the standard’s structure even where gaps exist, and then using those identified gaps to build a specific, prioritized business case for the technology or process investment actually needed to close them. This incremental approach tends to produce faster, more genuine progress than treating full technical readiness as a prerequisite before any dashboard work can begin, since even a partial, honestly incomplete first version reveals considerably more about the organization’s true reporting gaps than continuing to wait for a perfect, fully-featured system to arrive.
How does ISO 30414 handle organizations of meaningfully different sizes, from a small business to a large multinational?
The standard’s guidelines explicitly anticipate that capital investments and outcomes can be measured through a process simplified for smaller enterprises, rather than demanding the same depth of reporting infrastructure from a 50-person company that a multinational corporation with dedicated people-analytics teams would reasonably be expected to maintain. A smaller organization can genuinely still align with the standard’s core structure and 11 areas at a meaningfully reduced scale, focusing on a smaller, more targeted set of metrics within each area rather than attempting to replicate the full 69-metric depth a much larger organization might pursue.
