
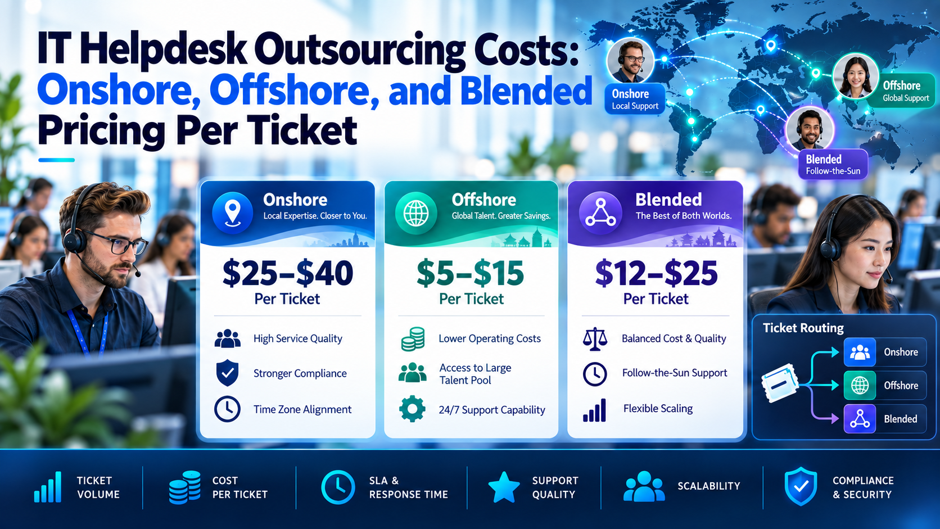
A company requests quotes from 3 outsourcing providers for its IT help desk and receives back 3 numbers that look nothing alike: $8 per hour, $12 per ticket, and $80 per user per month. None of these figures are directly comparable on their face, and without understanding exactly what sits behind each pricing model, choosing based on the lowest headline number alone risks locking into an arrangement that costs considerably more than expected once real ticket volume, complexity, and hidden factors like agent turnover actually play out.
Understanding what IT help desk outsourcing genuinely costs requires looking past a single quoted rate and into the specific pricing model, geographic delivery mix, and ticket complexity driving that number. This guide works through exactly how onshore, offshore, and blended pricing actually compare on a genuine per-ticket basis, the different pricing structures providers use, and the hidden cost factors that consistently separate a headline quote from the real, all-in number a business ends up paying.
TL;DR
| Delivery model | Typical hourly rate range | What it means for per-ticket cost |
| Offshore (Philippines, India) | Roughly $7 to $18 per hour | The lowest headline cost, though often carrying higher attrition and tighter Tier 1 scope |
| Nearshore (Latin America, Eastern Europe) | Roughly $12 to $30 per hour | A middle ground offering timezone alignment and moderate savings over onshore |
| Onshore (US, UK, Canada) | Roughly $25 to $65 per hour | The highest cost, typically justified by regulatory, compliance, or client-facing requirements |
| Blended delivery | Roughly $15 to $32 per hour | Combines multiple locations into a single rate, with actual savings depending on the real geographic mix |
| Per-ticket pricing | Roughly $1 to $25 per resolution | Price scales directly with issue complexity, from simple password resets to escalated technical work |
| Global blended per-ticket average | Roughly $8 to $20 per ticket | A useful benchmark, though healthcare and complex B2B tickets can run considerably higher |
The pattern across every row above reflects the same underlying truth: location and pricing model both matter enormously, but neither number means much in isolation without understanding the specific ticket mix, complexity, and hidden cost factors that ultimately determine the real, all-in price a business actually pays.
Why a Single Number Rarely Tells the Full Story
Before working through the specific pricing models and geographic rates in genuine, careful detail, it’s genuinely worth pausing here for a moment to understand exactly why comparing IT help desk outsourcing quotes is considerably more complex than comparing a single headline figure alone at first glance, before any real analysis begins.
The Specific Variables That Shape Any Given Quote
The core factors that explain why 2 providers can quote dramatically different numbers for what looks like the same underlying service:
- The specific pricing model used, whether per-ticket, hourly, per-seat, or a hybrid blend, since these structures allocate cost risk differently between the business and the provider
- The geographic delivery mix behind any blended rate, since a “blended” quote can range from mostly offshore with a thin onshore layer to something closer to an even split
- The actual distribution of ticket complexity across Tier 1, Tier 2, and Tier 3 work, since a contract weighted toward simple password resets costs considerably less than one handling significant escalated technical issues
- Coverage hours and service level commitments, since 24/7 availability costs meaningfully more than standard business-hours support
- What’s actually included in the quoted rate, since quality assurance, reporting, management overhead, and tooling licenses sometimes appear as separate line items rather than being bundled into the headline number
Why Mapping Ticket Distribution Matters Before Comparing Any Quotes
A contract weighted heavily toward Tier 1 issues, password resets and basic account unlocks, genuinely costs less than one carrying significant Tier 2 and Tier 3 work, making it essential to map an organization’s actual historical ticket distribution by tier before requesting or comparing quotes from any provider.
Why This Complexity Actually Works in a Buyer’s Favor Once Understood
While the variety of pricing models and variables can initially feel overwhelming, understanding them clearly gives a business genuine negotiating power, since providers quoting an artificially low headline rate while assuming a favorable ticket mix or excluding genuine costs can be identified and challenged directly, rather than accepted at face value.
The Core Pricing Models in Use
Understanding the specific structural models providers use to price IT help desk outsourcing clarifies exactly why the exact same underlying service can produce meaningfully, sometimes even dramatically different quotes, depending purely on which specific pricing model actually gets applied to that particular service and engagement in question.
The 5 Pricing Structures Worth Understanding
| Pricing model | How it works | Best suited for |
| Per-ticket pricing | A fixed or tiered price charged for each resolved ticket, ranging roughly from $1 to $25 depending on complexity | Organizations with predictable, well-understood ticket volume and complexity |
| Hourly or dedicated agent (FTE) | Billing based on actual agent hours worked, regardless of ticket volume during any given period | Organizations where ticket complexity varies widely and a flat per-ticket price would over- or under-pay |
| Per-seat or per-user monthly fee | A flat monthly charge per covered employee, commonly $80 to $150 for US-based delivery and $20 to $50 for Philippine-based delivery | Organizations with a stable, predictable headcount and consistent support needs |
| Hybrid or blended model | A base retainer covering a defined ticket volume, with overflow tickets billed at a separate per-ticket rate | Organizations wanting cost predictability without committing to a full dedicated team |
| Large-scale managed service | Per-seat or managed contracts with substantial minimums, commonly 50 or more seats and $1 million or more in annual commitment | Large enterprises needing global delivery scale across many countries simultaneously |
Why the Hourly Model Carries a Genuine Risk Worth Understanding
Billing based on actual agent hours means a business pays for agent time regardless of real ticket volume, meaning slow periods, late nights, weekends, or seasonal lulls, can result in paying for meaningfully underutilized capacity unless the contract includes genuine flexibility to scale staffing up and down with actual demand.
Why Per-Ticket Pricing Requires Especially Careful Complexity Definition
Per-ticket pricing only works fairly when both parties agree precisely on how complexity gets classified and priced, since a provider incentive purely by ticket count without a genuine complexity-based pricing tier has a structural incentive to close tickets quickly rather than thoroughly, a dynamic worth explicitly addressing in contract terms.
Onshore Pricing in Detail
The specific characteristics that define onshore IT help desk outsourcing pricing and where its cost premium genuinely comes from:
- Onshore rates in the US, UK, and Canada commonly range from $25 to $65 per hour, reflecting considerably higher labor costs than offshore or nearshore alternatives
- Australian onshore support runs even higher, commonly $40 to $65 per hour, reflecting that market’s particularly elevated labor cost structure
- Per-seat monthly pricing for US-based delivery typically runs $80 to $150 per covered user, several times the equivalent offshore rate
- The cost premium onshore delivery carries is most defensible for regulated industries, client-facing roles where regional accent or cultural nuance genuinely matters, and situations where data sovereignty or contractual obligations restrict offshore access entirely
Why Onshore Delivery Rarely Functions as a Pure Cost-Reduction Play
Onshore outsourcing, meaning contracting within an organization’s own home market, is genuinely rarely chosen primarily to reduce cost at all, since the labor rate differential compared to nearshore or offshore alternatives is simply too large to overcome through outsourcing efficiency alone for most operational support functions overall.
Why Specific Situations Still Justify the Onshore Premium
Highly regulated functions in financial services or healthcare, IP-sensitive technical work where genuine data sovereignty restricts offshore access, and executive or leadership-facing support roles all represent the clearest, most defensible cases where onshore delivery’s cost premium is genuinely justified on grounds well beyond pure price alone entirely.
Offshore Pricing in Detail
| Element | What the data shows |
| Typical hourly rate range | Roughly $7 to $18 per hour, with Philippine and Indian delivery centers representing the most common offshore locations |
| Per-ticket range for Tier 1 work | Commonly the lowest end of the overall per-ticket spectrum, often $1 to $10 for straightforward, well-documented issues |
| Per-seat monthly pricing | Roughly $20 to $50 per covered user for Philippine-based delivery, a fraction of equivalent US-based pricing |
| The genuine savings relative to fully loaded onshore cost | Commonly 60% to 70%, reflecting the gap between offshore and onshore rates without necessarily reflecting a meaningful quality difference for well-scoped Tier 1 work |
Why Offshore Delivery Works Particularly Well for High-Volume, Well-Documented Tier 1 Work
Offshore delivery’s cost advantage shows up most clearly, and carries the least genuine risk, when applied specifically to high-volume, well-documented Tier 1 issues, password resets, basic account access, and routine troubleshooting following clear, established scripts, precisely the category of work where geographic location matters least to actual resolution quality.
Why Offshore Pricing Alone Doesn’t Capture the Full Cost Picture
The headline offshore rate genuinely undersells the real comparison unless a business also accounts for attrition rates specific to that provider and delivery location, since offshore delivery centers frequently carry meaningfully higher turnover than nearshore or onshore alternatives, a factor covered in genuine detail later in this guide.
Nearshore Pricing and Why It Sits Between the 2 Extremes
Beyond the onshore and offshore comparison already covered above in this specific guide, nearshore delivery genuinely deserves its own dedicated, focused attention entirely on its own terms, since it occupies a genuinely distinct middle position rather than simply splitting the difference between the 2 extremes evenly.
The Specific Nearshore Markets Worth Understanding
| Market | What makes it distinct |
| Mexico | Offers full or near-full timezone overlap with most US time zones, a genuine advantage for real-time collaboration and escalation handling |
| Colombia | A fast-growing talent hub particularly strong in bilingual customer support and broader digital operations work |
| Poland | Eastern Europe’s strongest market for technical and multilingual roles, with genuine depth specifically in fintech, cybersecurity, and enterprise software support |
| Broader Latin America and Eastern Europe | Typically priced in the $12 to $30 per hour range, positioning nearshore meaningfully below onshore while still commanding a premium over pure offshore delivery |
Why Timezone Alignment Specifically Justifies Nearshore’s Price Premium Over Offshore
The genuine value nearshore delivery adds over pure offshore often comes down less to skill or quality difference and more to timezone alignment specifically, since a nearshore team working genuinely overlapping hours with a US-based business can handle real-time escalations and collaborative troubleshooting in ways a 12-hour timezone gap makes considerably more difficult for a pure offshore team to match.
Why Nearshore Often Represents the Strongest Value for Mixed Tier 1 and Tier 2 Workloads
Organizations with a genuine mix of Tier 1 and Tier 2 work, rather than an overwhelmingly Tier 1-weighted ticket distribution, frequently find nearshore delivery offers the strongest overall value, since it captures meaningful cost savings over onshore while still providing the timezone alignment and moderate skill premium that pure offshore delivery doesn’t always guarantee for the more complex end of that workload.
Blended and Hybrid Pricing in Detail
The specific mechanics worth understanding about how blended pricing actually gets constructed, since the term itself can mean genuinely different things across different providers:
- A blended rate combines multiple delivery locations into a single quoted number, commonly landing somewhere in the $15 to $32 per hour range depending on the actual geographic mix behind it
- The specific share of work handled in each location directly determines where within that range a given quote actually lands, meaning 2 providers both quoting “$20 blended” could carry meaningfully different real-world delivery mixes
- Major global providers commonly deliver blended pricing across dozens of countries simultaneously, with Philippine-based components typically pricing near the lower end of the blended range and onshore or nearshore European components pricing considerably higher
- A hybrid model specifically combining a base retainer for predictable volume with per-ticket overflow pricing gives a business genuine cost predictability for typical months while still accommodating unexpected spikes
Why Asking for the Underlying Geographic Split Matters More Than Accepting the Blended Average
When a provider quotes a blended rate, asking directly what specific share of the program actually sits in each delivery location, rather than simply accepting the quoted average as a meaningful benchmark on its own, reveals whether that blended number reflects genuine geographic diversity or is weighted heavily toward one location with only a thin layer elsewhere.
Why Many Organizations Specifically Choose a Hybrid Approach for Quality-Cost Balance
Combining onshore quality assurance and escalation handling with offshore front-line Tier 1 delivery represents a genuinely common hybrid approach, letting a business capture off shore’s cost advantage for high-volume routine work while retaining onshore oversight and escalation handling for the situations where that oversight genuinely matters most.
How Ticket Tier and Complexity Change the Real Cost
Beyond geography and pricing model alone, the actual complexity of the tickets genuinely flowing through a help desk directly and substantially shapes the genuine, real underlying cost of the entire program, regardless of which specific delivery location or pricing structure ultimately ends up getting selected in the end.
The Complexity-to-Cost Relationship
| Tier | Typical issue examples | Relative cost impact |
| Tier 1 | Password resets, basic account unlocks, routine how-to questions | The lowest cost tier, commonly well suited to offshore delivery and per-ticket pricing |
| Tier 2 | Software configuration issues, moderate troubleshooting, escalated access requests | A meaningfully higher cost tier, often requiring more experienced agents and longer handle times |
| Tier 3 | Complex technical escalations, system-level troubleshooting, specialized application support | The highest cost tier, frequently requiring onshore or nearshore delivery given the specialized expertise involved |
Why Industry Context Also Meaningfully Affects Per-Ticket Cost
Healthcare and complex B2B support tickets commonly run considerably higher than the general blended average, in some documented cases reaching up to $60 per ticket, reflecting both the specialized knowledge these industries genuinely require and the regulatory and compliance overhead that often accompanies support work in these specific sectors.
Why Understanding This Relationship Prevents a Common, Costly Miscalculation
A business that negotiates a low blended per-ticket rate without accounting for its own actual tier distribution risks a genuine mismatch once real ticket volume flows through the contract, since a provider quoting an attractive average rate assuming a heavily Tier 1-weighted mix will either push back on pricing or struggle with quality once the real distribution includes meaningfully more Tier 2 and Tier 3 work than initially assumed.
The Hidden Costs That Change the Real Per-Ticket Number
Beyond the headline rate itself, several specific hidden cost factors consistently separate a quoted price from what a business actually ends up paying over the life of a contract:
- Agent attrition and turnover, since every departure triggers recruiting, on-boarding, and ramp-to-productivity costs that never appear as a separate line item on any invoice but genuinely affect real service quality and continuity
- Idle time under hourly billing models, since a business is billed for agent hours regardless of actual ticket volume, meaning slow periods can result in paying for meaningfully underutilized capacity
- One-time setup and on-boarding fees, ranging from roughly $1,500 to $5,000 for smaller, more nimble providers up to $50,000 to $200,000 for large-scale BPO engagements with substantial seat minimums
- Coverage hour premiums, since genuine 24/7 availability costs meaningfully more than standard business-hours support, a difference not always obvious in a simple hourly rate comparison
- Multilingual support surcharges, commonly adding 20% to 40% to base pricing when support needs to extend beyond a single primary language
Why Attrition Specifically Deserves Close, Direct Scrutiny During Vendor Evaluation
A provider quoting a lower hourly rate but carrying meaningfully higher attrition can genuinely cost more over the full life of a contract than a provider quoting a higher rate with considerably lower turnover, since every departure and subsequent ramp cycle degrades service quality and consumes real management time that a simple hourly comparison entirely misses.
Why Requesting Specific Attrition and Ramp-Time Data Belongs in Every Vendor Evaluation
Asking directly for a provider’s rolling 12-month attrition rate, average training and ramp time, first-contact resolution rate, and escalation percentage, rather than evaluating purely on the headline rate, surfaces exactly the kind of hidden cost differential that separates a genuinely strong long-term partner from a provider whose attractive initial quote conceals meaningfully higher real total cost.
Working Through a Realistic Cost Example
Translating the pricing models and hidden costs already covered above throughout this entire guide into one concrete, genuinely worked example genuinely helps ground the abstract comparison in real, practical, usable numbers directly and quite clearly for any reader currently working through this exact decision right now.
A Sample Calculation Worth Working Through
The specific steps a business can follow to build its own realistic cost estimate before requesting formal vendor quotes:
- Starting with genuine, historical monthly ticket volume, since an accurate estimate depends entirely on knowing roughly how many tickets the help desk actually handles in a typical month
- Applying a realistic blended per-ticket rate based on the organization’s actual tier distribution, commonly landing somewhere between $8 and $20 per ticket for a genuinely mixed Tier 1 and Tier 2 workload
- Adding a one-time setup cost appropriate to the provider’s scale, commonly $1,500 to $5,000 for a smaller, more flexible provider
- Building in a reasonable buffer for peak months or seasonal ticket volume spikes, rather than budgeting purely against an average monthly figure
- Refining this initial estimate against an actual, itemized provider quote before finalizing any budget commitment
Why a Simple Illustrative Calculation Makes the Numbers Concrete
A business handling roughly 1,000 monthly tickets at a genuinely blended rate of $12 per ticket arrives at approximately $12,000 in monthly spend, plus whatever one-time setup cost the specific provider’s on-boarding process requires, giving a business a concrete, defensible starting point for budget planning well before formal vendor negotiations begin.
Why This Estimate Should Function as a Starting Point Rather Than a Final Number
This kind of preliminary calculation genuinely helps establish a realistic budget expectation, but it should always be refined against an actual, itemized provider quote reflecting the organization’s genuine ticket distribution, coverage hour requirements, and any specific compliance or language needs, rather than treated as a final, binding figure on its own.
In-House Versus Outsourced: The Baseline Worth Understanding
Before finalizing any outsourcing decision at all, it’s genuinely worth taking the time to carefully and honestly understand exactly how outsourced pricing genuinely compares against the genuine, fully loaded cost of running that same equivalent function entirely in-house instead, without outsourcing any of it at all.
The Fully Loaded In-House Cost Picture
| Cost component | What it adds to the base wage |
| Base hourly wage for US in-house support | Commonly around $19 to $20 per hour on average |
| Benefits loading | Typically adds 25% to 40% above the base wage |
| Management and overhead | Typically adds another 20% to 30% on top of wages and benefits combined |
| Technology and tooling costs | Commonly $80 to $150 per agent per month, layered on top of labor costs entirely |
| The resulting fully loaded cost | Commonly lands in the $28 to $40 per hour range once every component is genuinely accounted for |
Why Outsourcing’s Genuine Savings Show Up Clearly at This Fully Loaded Comparison Point
Outsourcing reduces total support cost by roughly 41% to 73% relative to a fully loaded, in-house US team, a genuinely significant range reflecting how dramatically delivery location and pricing model can shift the real comparison once every hidden in-house cost component gets properly counted rather than comparing only base wages.
Why This Comparison Still Requires Genuine Nuance Rather Than a Blanket Conclusion
While the aggregate savings figures are genuinely compelling, the specific savings any individual organization actually realizes depends heavily on its own particular ticket mix, compliance requirements, and how much of its support work genuinely belongs in the lower-cost tiers this comparison assumes, meaning the headline savings percentage functions best as a general benchmark rather than a guaranteed outcome for every specific situation.
What’s Actually Included in a Quoted Rate
Beyond the geographic and complexity factors already covered throughout this entire guide, a genuinely accurate cost comparison requires directly and explicitly confirming exactly what a specific provider’s quoted rate actually includes in full, since this varies considerably even among providers quoting superficially similar-looking numbers on the surface.
The Specific Elements Worth Confirming Are Included Before Comparing Quotes
The components that should be explicitly confirmed as included, or identified as separate additional costs, before treating any quote as genuinely comparable to another:
- Quality assurance and call monitoring, since some providers bundle this directly into the base rate while others charge it as a separate management fee
- Reporting and analytics dashboards, since genuine visibility into ticket volume, resolution time, and agent performance sometimes carries its own additional licensing cost
- Management and supervisory overhead, since a rate covering only front-line agent time without dedicated team leadership can produce meaningfully weaker service consistency
- Tooling and software licensing, since some providers include their own ticketing and communication platform within the quoted rate while others expect the client to provide and license these tools separately
- Security and compliance certifications, since maintaining standards like SOC 2 Type II, ISO 27001, HIPAA, or GDP compliance carries genuine operational cost that a lower-priced provider may not be absorbing to the same degree
Why Compliance Certifications Specifically Deserve Direct Verification, Not Just a Claimed Checkbox
Organizations handling any regulated or sensitive data through their help desk, healthcare information, financial records, or personally identifiable customer data, should verify a provider’s specific compliance certifications directly rather than accepting a general claim of “compliant” at face value, since the genuine cost of maintaining certifications like HIPAA or SOC 2 Type II is real and should be reflected transparently in how a provider prices its service.
Why an Itemized Quote Consistently Produces a More Trustworthy Comparison Than a Single Bundled Number
Requesting an itemized breakdown showing base labor cost separately from tooling, management, quality assurance, and compliance overhead, rather than accepting a single bundled rate, gives a business genuine visibility into where its money actually goes and makes it considerably easier to identify whether a lower-priced competitor is achieving that lower price through genuine efficiency or simply by omitting components a more transparent provider includes by default.
Common Mistakes When Evaluating Help-desk Outsourcing Costs
Beyond understanding the specific pricing models and hidden costs already covered throughout this entire guide, several recurring, genuinely predictable mistakes show up consistently among organizations evaluating IT help desk outsourcing, and avoiding these specific mistakes meaningfully improves the odds of a genuinely accurate cost comparison overall in the end.
Comparing headline rates across providers without confirming they reflect the same pricing model. An hourly rate, a per-ticket price, and a per-seat monthly fee aren’t directly comparable numbers, and evaluating them side by side without converting to a genuinely common basis produces a misleading comparison.
Accepting a blended rate without asking about the underlying geographic mix. As covered directly above, 2 providers quoting similar blended numbers can carry meaningfully different real delivery splits, and failing to ask this specific question risks a genuine mismatch between expectation and reality.
Ignoring attrition rates in favor of the lowest headline hourly rate. A provider’s genuine total cost over a contract’s full life depends heavily on turnover and ramp time, factors a simple hourly rate comparison entirely misses.
Failing to map actual ticket tier distribution before requesting quotes. Without genuine historical data on how much support volume falls into Tier 1 versus Tier 2 and Tier 3, a business risks accepting a quote priced for a more favorable mix than its actual support needs genuinely require.
Treating setup and on-boarding costs as an afterthought rather than a genuine budget line item. One-time setup fees, particularly for larger-scale engagements, can represent a meaningful portion of first-year cost and deserve explicit inclusion in any genuine budget comparison across providers.
FAQs
Is per-ticket pricing genuinely cheaper than hourly pricing for most organizations?
This depends heavily on how predictable and consistent an organization’s ticket complexity actually is; per-ticket pricing works well when complexity stays genuinely consistent, while hourly pricing better accommodates organizations where ticket complexity varies widely enough that a flat per-ticket rate would either overpay for simple issues or underpay for genuinely complex ones.
How much should a business expect to pay in setup fees when outsourcing IT help desk support for the first time?
This varies considerably by provider scale, commonly ranging from roughly $1,500 to $5,000 for a smaller, more flexible provider up to $50,000 or more for a large-scale managed service engagement carrying substantial seat minimums and multi-country delivery infrastructure.
Does choosing offshore delivery genuinely mean sacrificing support quality?
Not inherently, particularly for well-documented Tier 1 work where geographic location matters relatively little to resolution quality, though a business should genuinely evaluate a specific provider’s attrition rate, training process, and first-contact resolution data rather than assuming offshore delivery automatically implies lower quality across the board.
How should a business decide between a pure offshore model and a hybrid onshore-offshore approach?
This decision should follow directly from the organization’s own genuine ticket tier distribution and risk tolerance, with a pure offshore model working well for organizations whose support needs skew heavily toward routine Tier 1 issues, while a hybrid approach better serves organizations needing genuine onshore oversight or escalation handling for a meaningful share of Tier 2 and Tier 3 work.
Should a business always negotiate for the lowest quoted blended rate available?
Not necessarily, since the lowest headline rate doesn’t always reflect the lowest genuine total cost once attrition, ramp time, and service quality are properly factored in, making it considerably more valuable to negotiate based on total cost of ownership, including these specific hidden factors, rather than the quoted rate alone.
How often should a business revisit its outsourcing pricing model as ticket volume or complexity changes over time?
An annual review is a reasonable baseline, though any significant shift in ticket volume, complexity distribution, or coverage hour requirements should trigger an earlier review, since a pricing model well suited to an organization’s needs at one point can become genuinely mismatched as those underlying needs continue to evolve.
Is it realistic to negotiate below a provider’s published rate card, or are these figures generally fixed? Published rate cards, particularly for smaller and mid-market providers, frequently carry genuine negotiation room, especially for longer contract commitments or larger guaranteed ticket volumes, while large-scale managed service engagements with substantial seat minimums tend to offer somewhat less flexibility given their more standardized, volume-driven pricing structure.
How does support coverage requirement, such as 24/7 versus standard business hours, actually translate into the final quoted price?
Extending coverage from standard business hours into genuine 24/7 availability typically increases cost meaningfully, since it requires either a larger overall team to cover additional shifts or a premium paid to existing staff for off-hours work, and this difference isn’t always obvious when comparing 2 providers’ hourly rates directly, making it essential to confirm explicitly whether a quoted rate already assumes the coverage hours an organization actually needs or would require a separate premium to extend into.
Should a business request pricing for a pilot period before committing to a full annual contract?
Yes, and this is genuinely one of the more practical ways to validate a provider’s actual performance, including real first-contact resolution rates, genuine response times, and early attrition signals, against what was promised during the sales process, before committing to a longer-term contract where any mismatch between promised and actual performance becomes considerably more costly and disruptive to unwind.
Does the pricing model itself change how easy it is to scale support up or down as ticket volume genuinely fluctuates?
Yes, and this is a genuinely important factor beyond the base rate itself; per-ticket and hybrid overflow pricing structures naturally scale with actual demand without requiring a contract renegotiation, while a fixed per-seat or dedicated FIE model typically requires an explicit conversation with the provider to add or reduce staffing, making the underlying pricing model worth weighing specifically against how predictable or seasonal an organization’s own ticket volume genuinely tends to be throughout the year.
